Pages

Wednesday, July 7, 2021

PEEL Structure Analysis


 I learnt PEEL structure to write Analysis 
http://www.jake4maths.com/grapher/imagetemp/oPIezSbiO5.png

Back weight 

Forward weight 


Min

77

98 

21 

LQ

88

104.5

16.5 

Median

92

110.5

18.5 

UQ

96

117

21 

Max

105 

137

32

Range =Max - Min


105 - 77 = 28 

137 - 110.5 = 39

11

Inter quartile range= UQ-Lq

96 - 88 = 8 

117 - 104.5 = 12.5 

4.5 


(1) Centre: I notice that the median weight of the forward sample is slightly higher/significantly higher /similar than the back weight  sample median. This means that there is only a small/huge/no difference between the median weights for this sample. The median weight for the forward is 110.5kg which is only 18.5kg higher than the back weight median of 92kg .

(2) SPREAD:

IQR (Interquartile range)= upper quartile - lower quartile

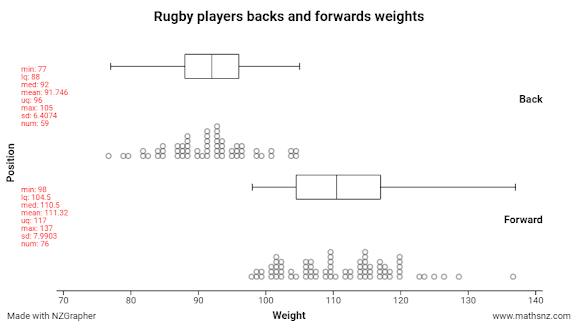
IQR of Back - IQR of Forward

I notice that the middle 50% of the weights for each of the sample distributions have a slightly higher/significantly higher /similar spread.

This means that there is only a small/huge/no difference between the median weight for this sample. The IQR for the forward sample is 12.5 m and the IQR for the back sample is 8kg

.

(3) SHIFT/OVERLAP:

I notice that there is significant/slightly/ does not overlap between the forward and back middle 50% of  weights  in this sample distribution. The LQ, median, UQ of the forward sample is only slightly higher than the female sample.

This indicates that there is not much/ huge difference between the weight of forward and back students in this sample.

The forward sample LQ has shifted 16.5 up the scale, the median has shifted 21 up the scale and the UQ has shifted 21 up the scale.

1 comment: